massqc_cumulative_rsd_plot
massqc_cumulative_rsd_plot(..., title, rsd_cutoff, color)Arguments
- ...
one or more mass_dataset object
- title
missing or same length (character vector) with ...
- rsd_cutoff
numeric
- color
when one mass_dataset, the line color
Value
ggplot2 plot.
Examples
library(massdataset)
library(ggplot2)
data("expression_data")
data("sample_info")
data("variable_info")
object =
create_mass_dataset(
expression_data = expression_data,
sample_info = sample_info,
variable_info = variable_info
)
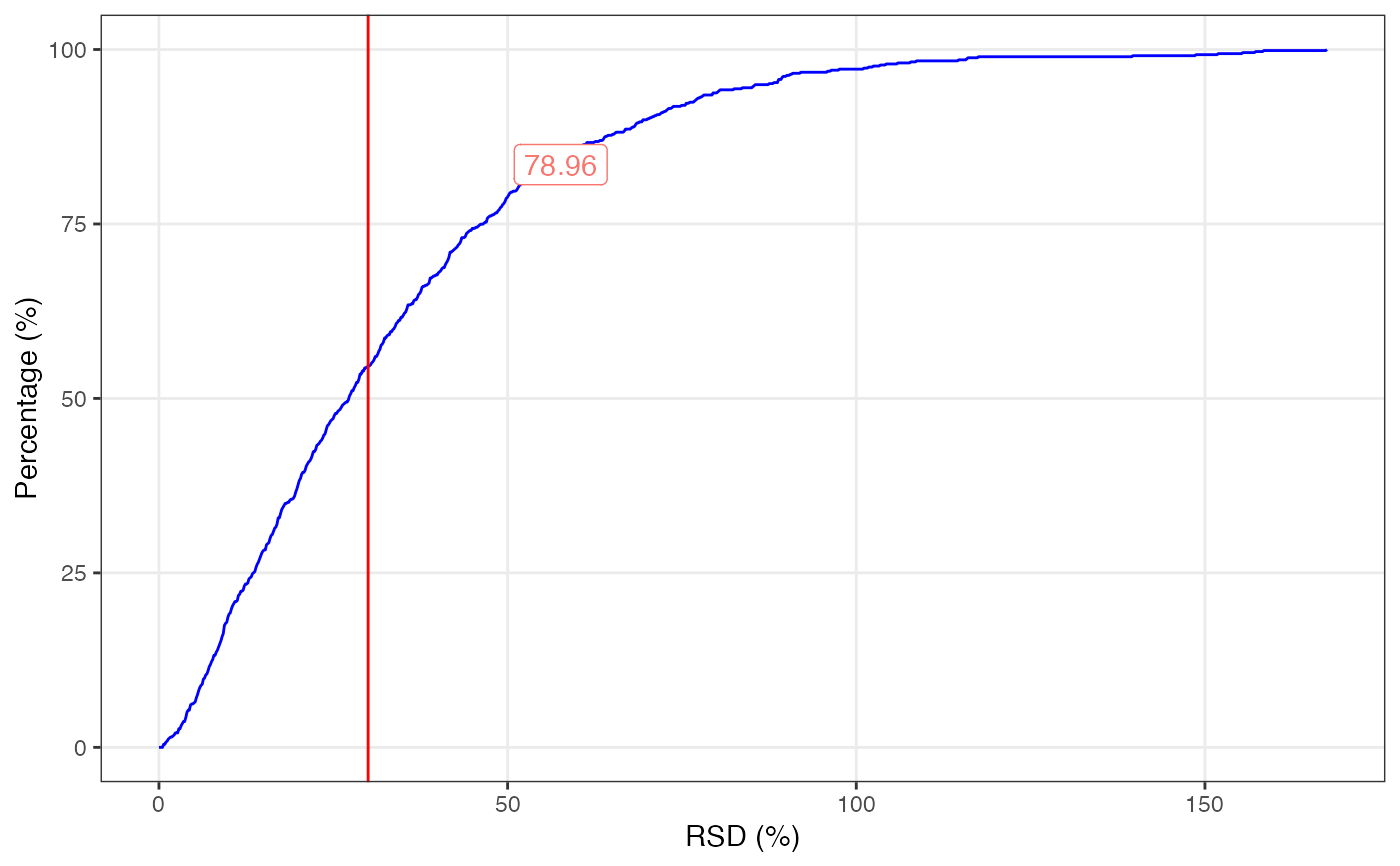
massqc_cumulative_rsd_plot(object, rsd_cutoff = 30, color = "blue")
 object1 =
object %>%
activate_mass_dataset(what = "sample_info") %>%
dplyr::filter(class == "QC")
object2 =
object %>%
activate_mass_dataset(what = "sample_info") %>%
dplyr::filter(class == "Subject")
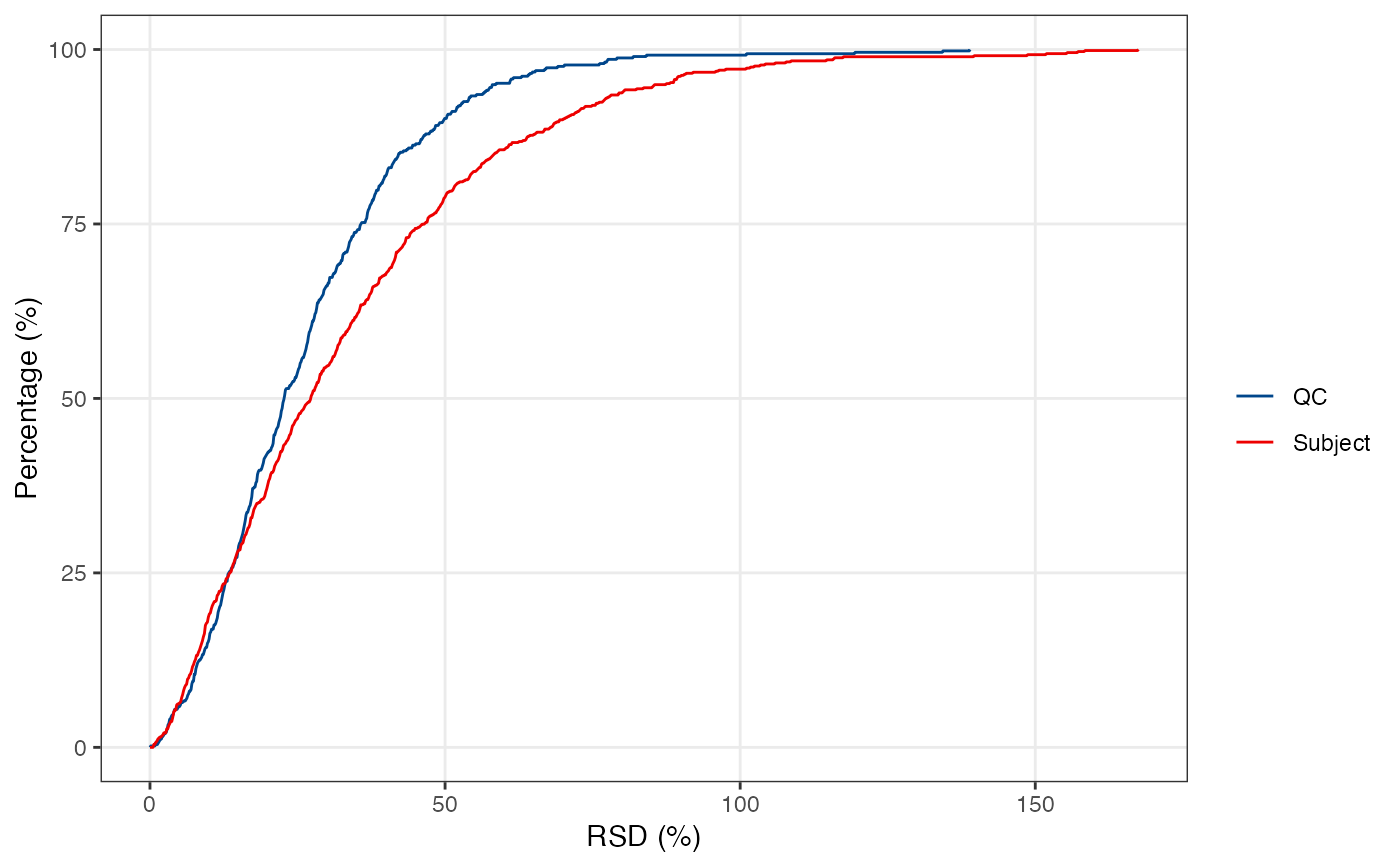
massqc_cumulative_rsd_plot(object1, object2,
title = c("QC", "Subject")) +
ggsci::scale_color_lancet()
object1 =
object %>%
activate_mass_dataset(what = "sample_info") %>%
dplyr::filter(class == "QC")
object2 =
object %>%
activate_mass_dataset(what = "sample_info") %>%
dplyr::filter(class == "Subject")
massqc_cumulative_rsd_plot(object1, object2,
title = c("QC", "Subject")) +
ggsci::scale_color_lancet()
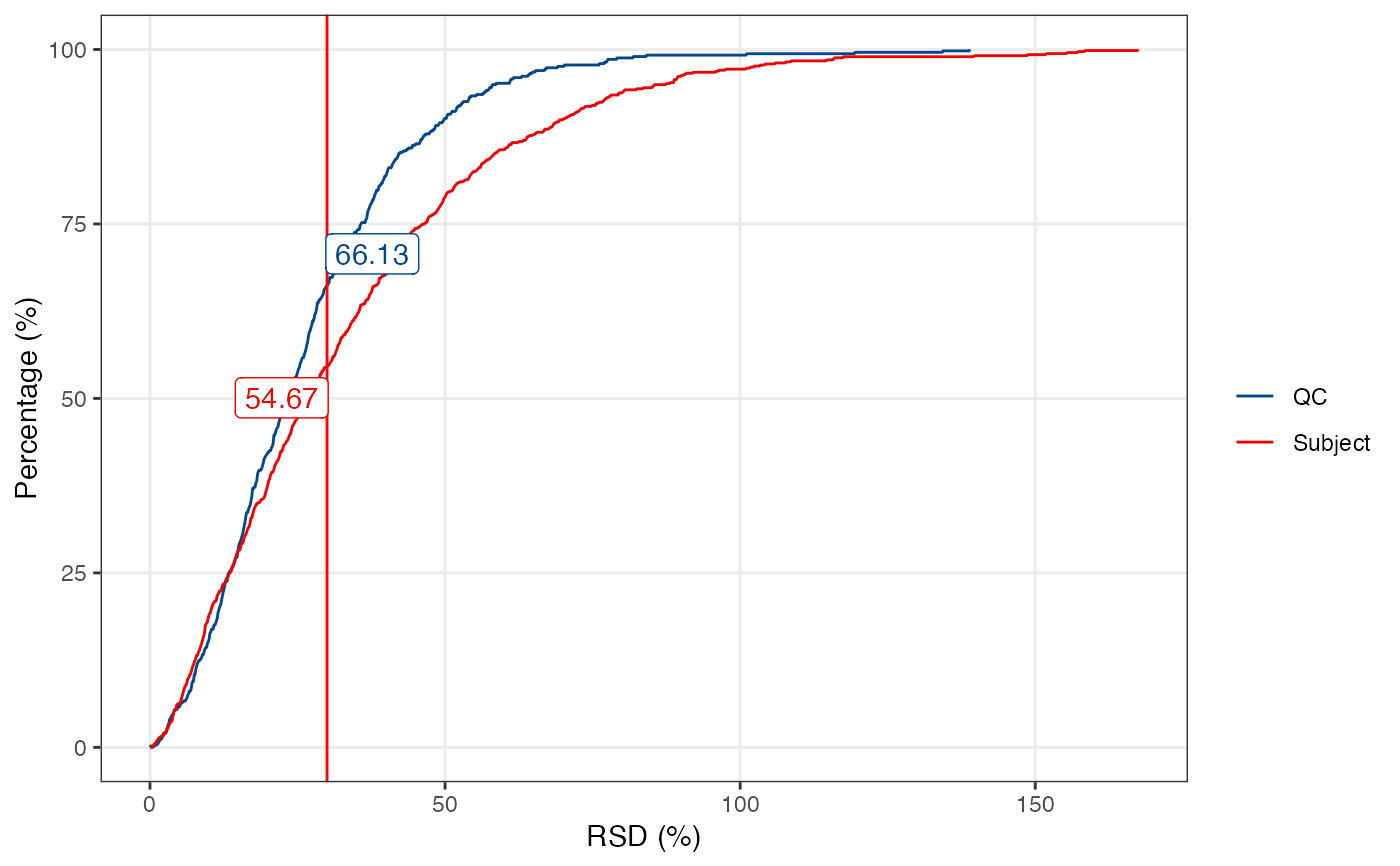
 massqc_cumulative_rsd_plot(object1,
object2,
rsd_cutoff = 30,
title = c("QC", "Subject")) +
ggsci::scale_color_lancet()
massqc_cumulative_rsd_plot(object1,
object2,
rsd_cutoff = 30,
title = c("QC", "Subject")) +
ggsci::scale_color_lancet()
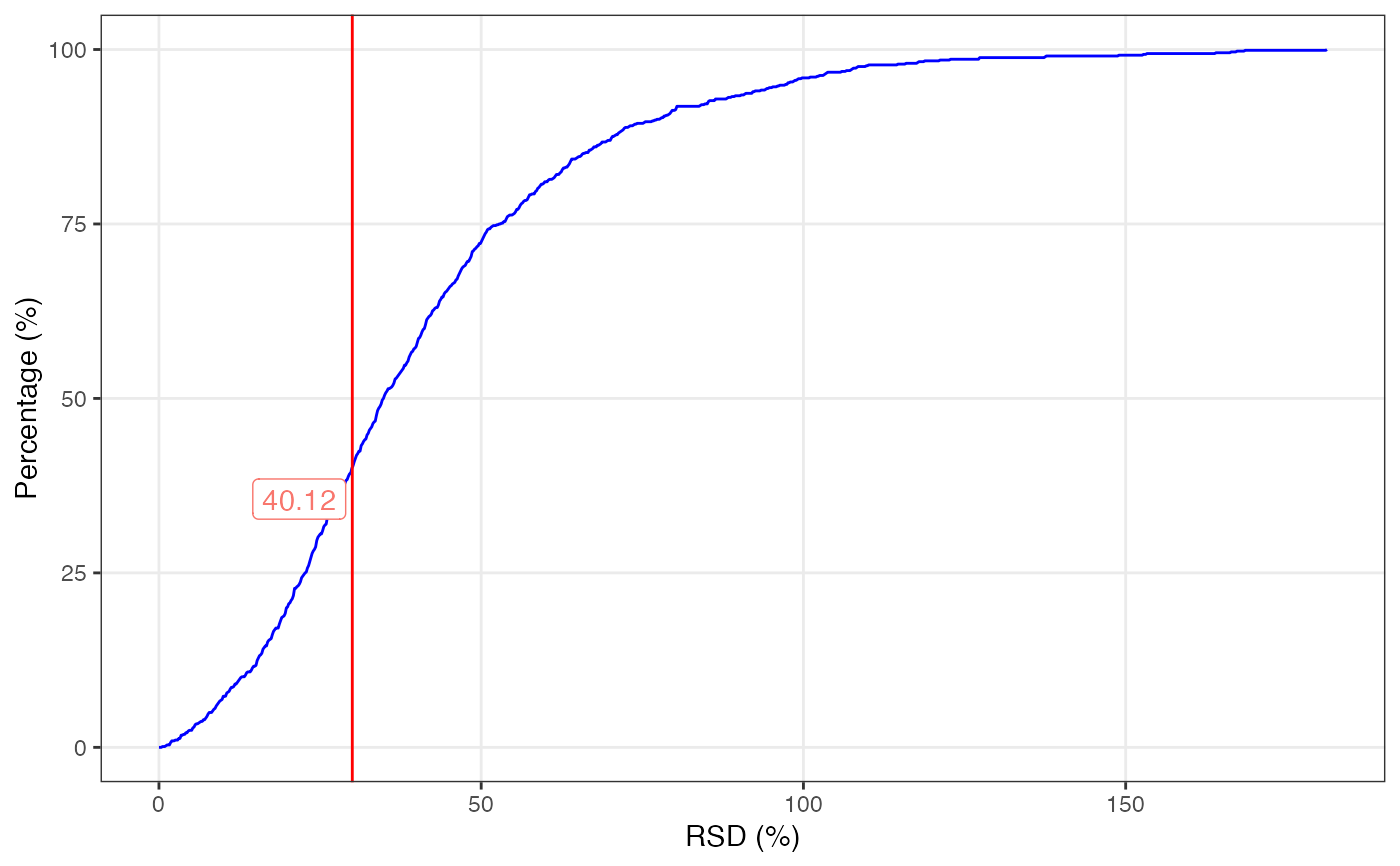
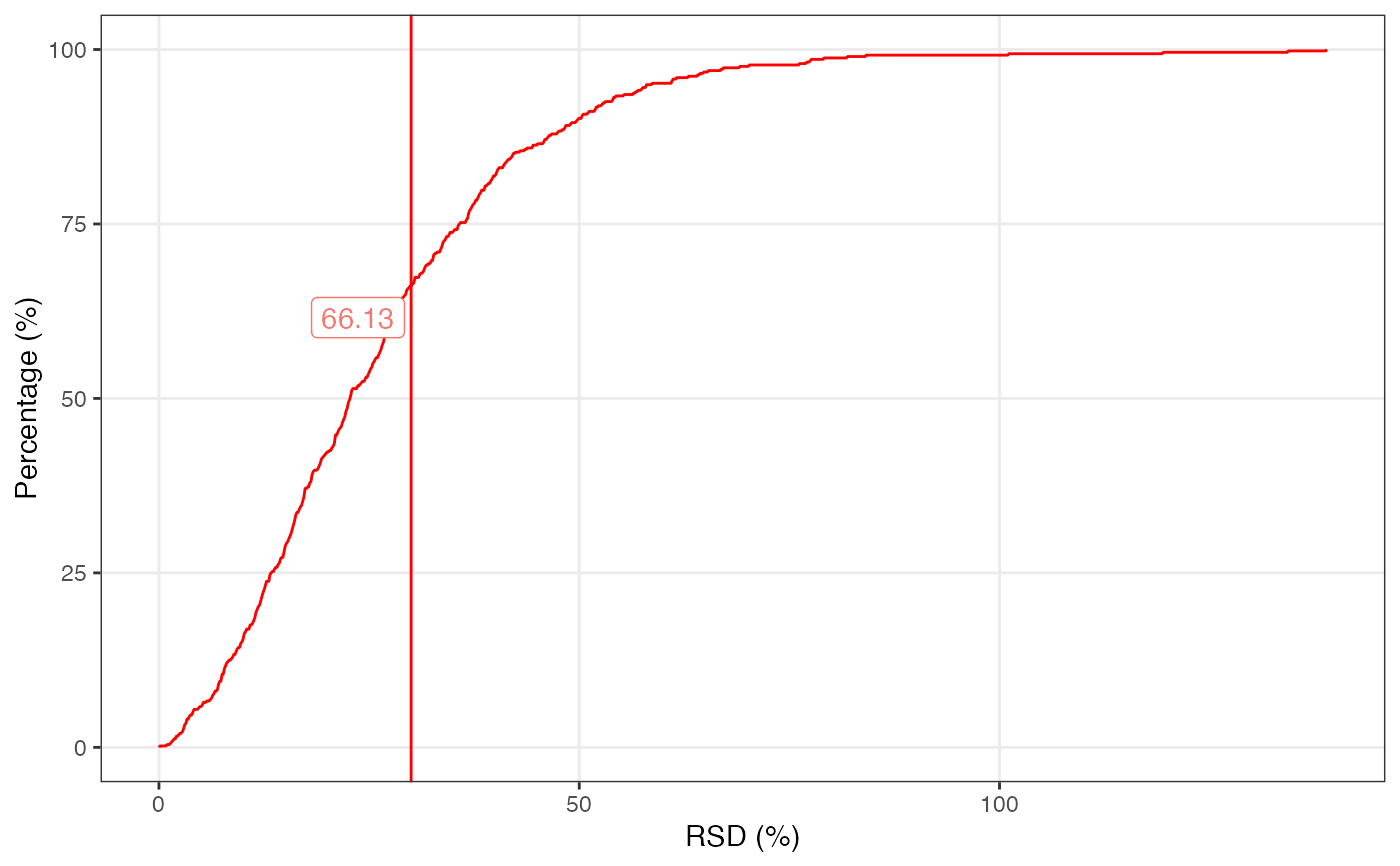
 massqc_cumulative_rsd_plot(
object1,
title = c("QC"),
color = "red",
rsd_cutoff = 30
)
massqc_cumulative_rsd_plot(
object1,
title = c("QC"),
color = "red",
rsd_cutoff = 30
)
 massqc_cumulative_rsd_plot(
object2,
title = c("Subject"),
color = "blue",
rsd_cutoff = 50
)
massqc_cumulative_rsd_plot(
object2,
title = c("Subject"),
color = "blue",
rsd_cutoff = 50
)