Boxplot for each samples.
massqc_sample_boxplot(
  object,
  color_by,
  fill_by,
  order_by = "sample_id",
  outlier.shape = NA,
  point = FALSE,
  point_alpha = 0.8
)
Arguments
- object
tidymass-class object.
- color_by
which column (sample_info) is used to color samples
- fill_by
which column (sample_info) is used to fill samples
- order_by
which column (sample_info) is used to order samples
- outlier.shape
outlier.shape from ggplot2.
- point
point or not.
- point_alpha
point_alpha
Value
ggplot2 plot.
Examples
library(massdataset)
library(ggplot2)
data("expression_data")
data("sample_info")
data("variable_info")
object =
create_mass_dataset(
expression_data = expression_data,
sample_info = sample_info,
variable_info = variable_info
)
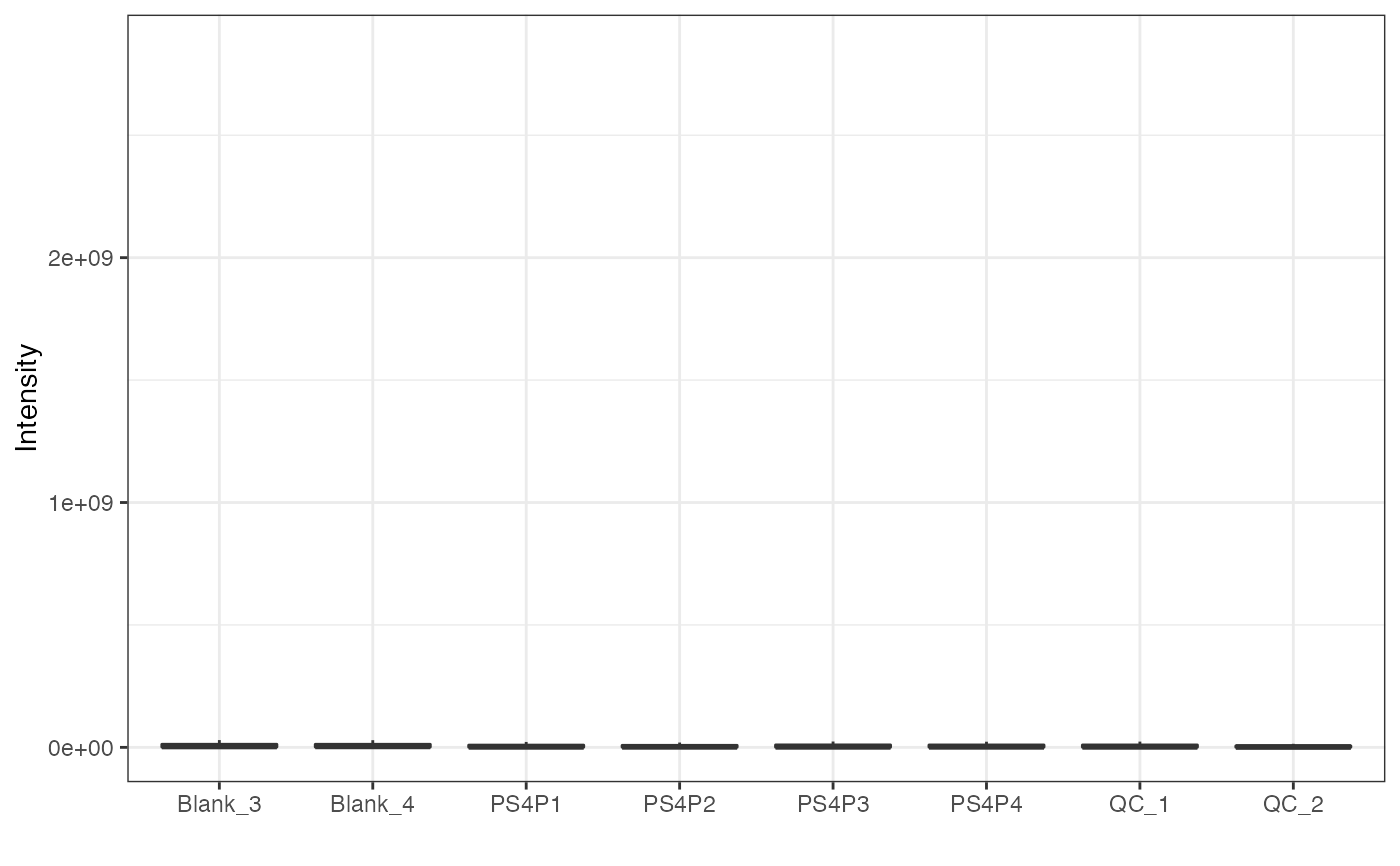
object %>%
massqc_sample_boxplot()
#> Warning: NA will be removed in the boxplot.
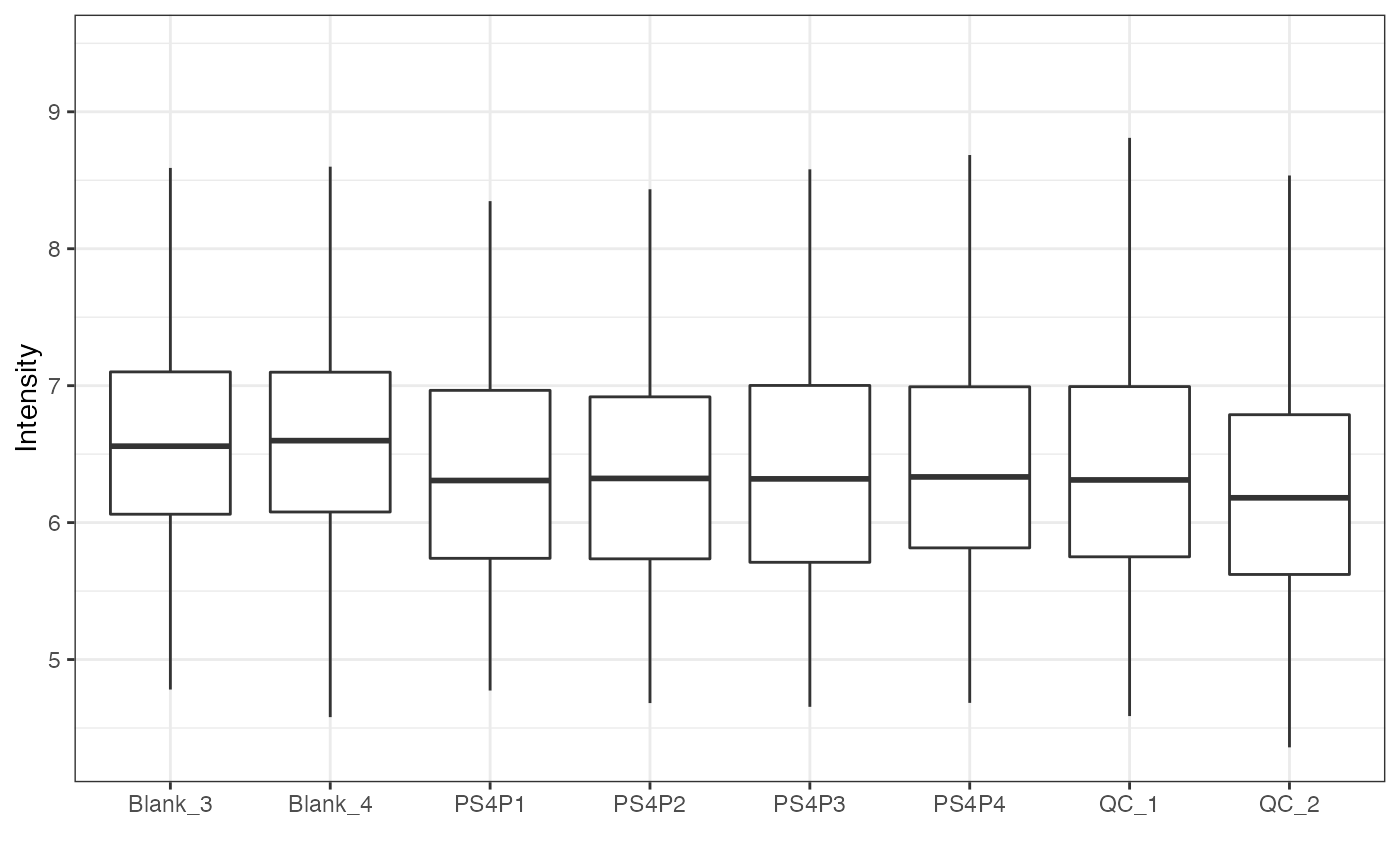
 object %>%
log(10) %>%
massqc_sample_boxplot()
#> Warning: NA will be removed in the boxplot.
object %>%
log(10) %>%
massqc_sample_boxplot()
#> Warning: NA will be removed in the boxplot.
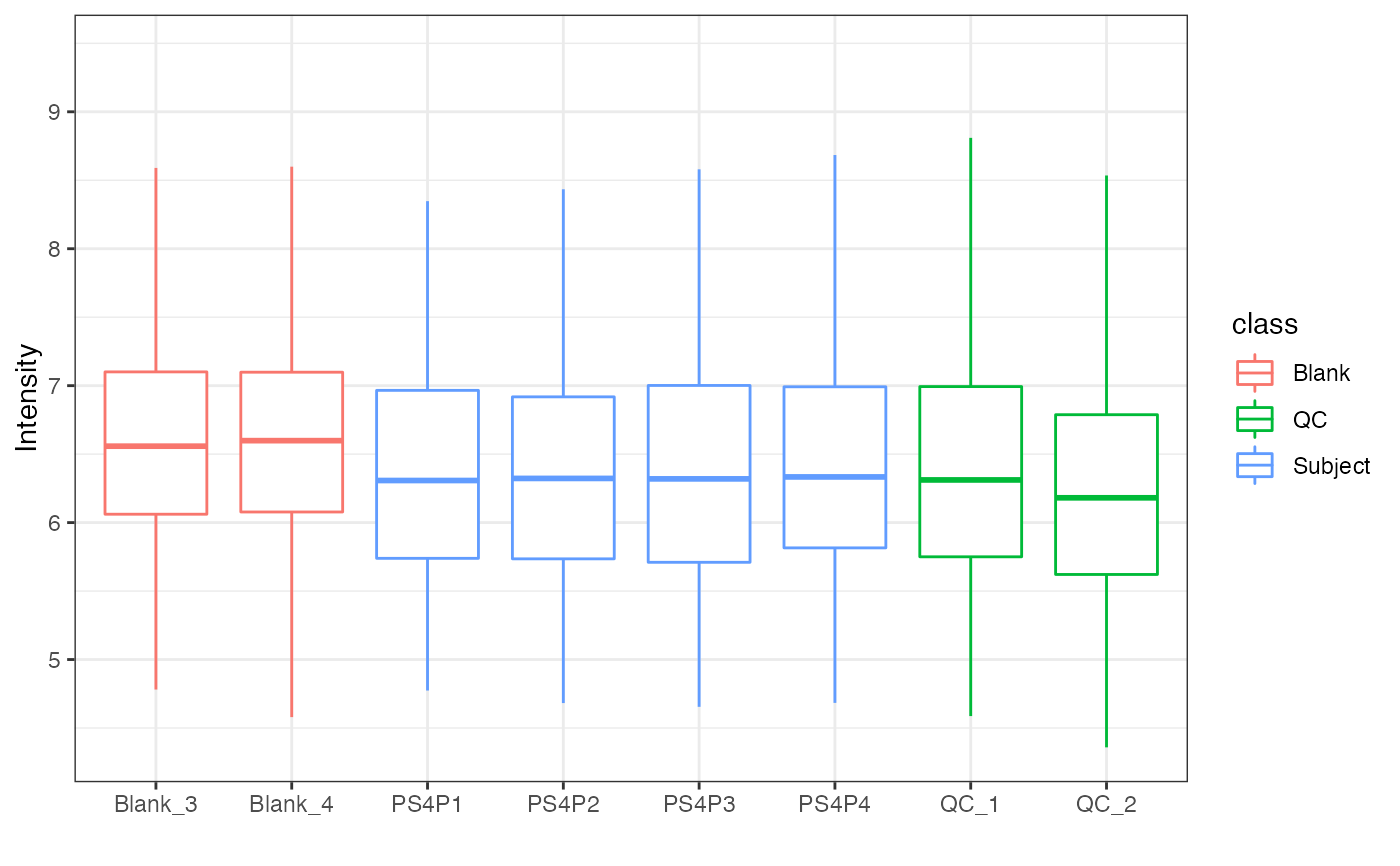
 object %>%
log(10) %>%
massqc_sample_boxplot(color_by = "class")
#> Warning: NA will be removed in the boxplot.
object %>%
log(10) %>%
massqc_sample_boxplot(color_by = "class")
#> Warning: NA will be removed in the boxplot.
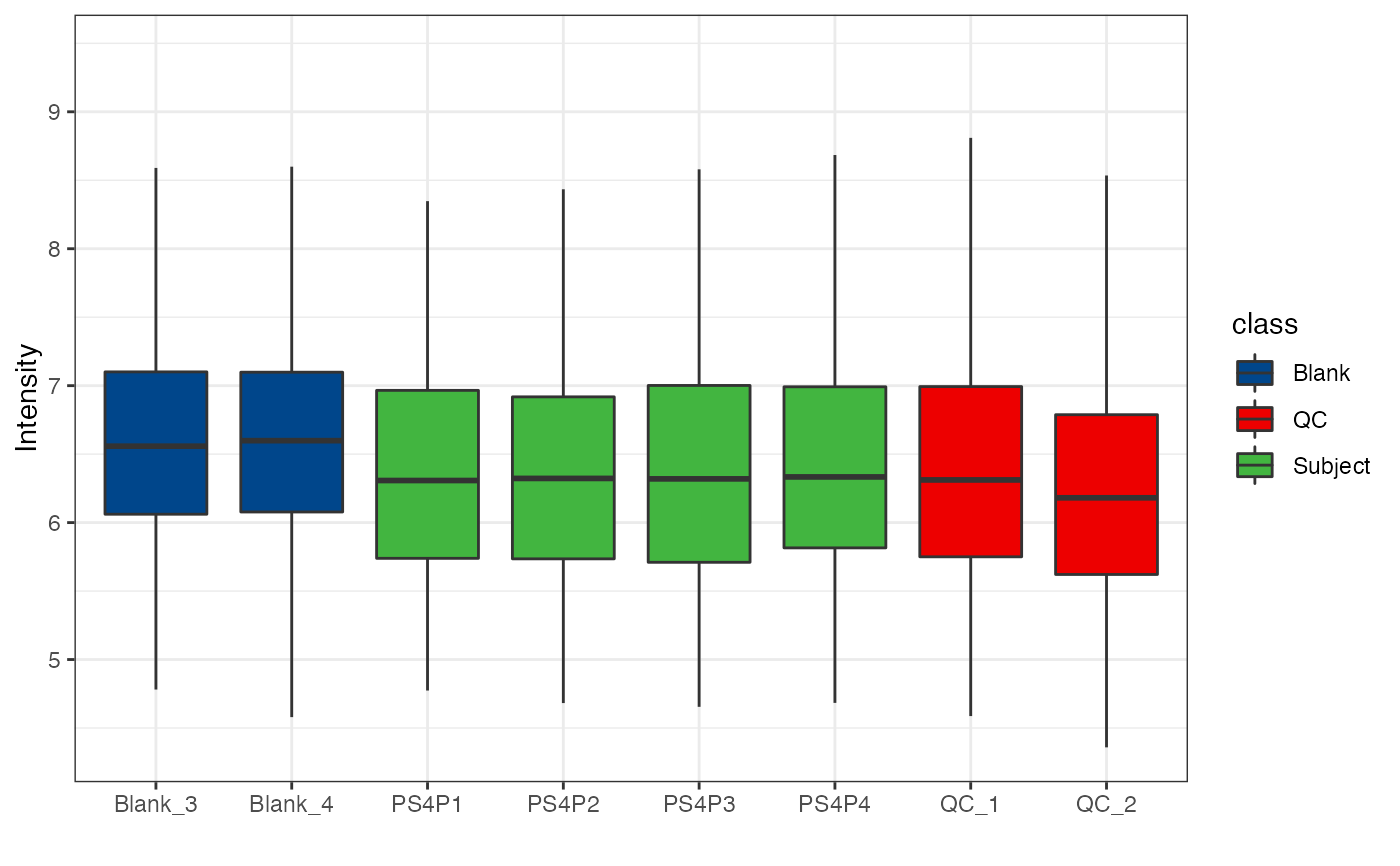
 object %>%
log(10) %>%
massqc_sample_boxplot(fill_by = "class") +
ggsci::scale_fill_lancet()
#> Warning: NA will be removed in the boxplot.
object %>%
log(10) %>%
massqc_sample_boxplot(fill_by = "class") +
ggsci::scale_fill_lancet()
#> Warning: NA will be removed in the boxplot.
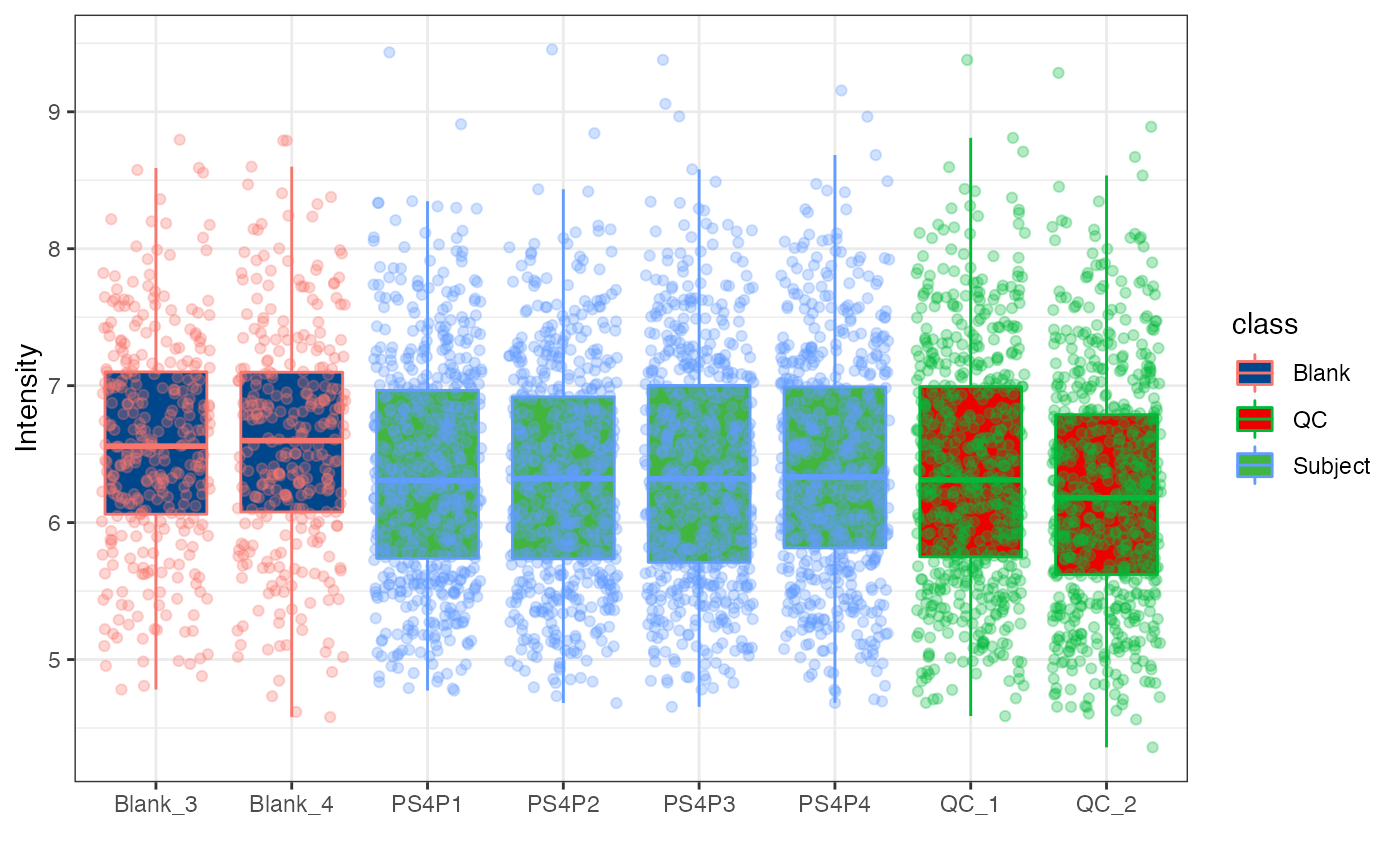
 object %>%
log(10) %>%
massqc_sample_boxplot(
fill_by = "class",
color_by = "class",
point = TRUE,
point_alpha = 0.3
) +
ggsci::scale_fill_lancet()
#> Warning: NA will be removed in the boxplot.
object %>%
log(10) %>%
massqc_sample_boxplot(
fill_by = "class",
color_by = "class",
point = TRUE,
point_alpha = 0.3
) +
ggsci::scale_fill_lancet()
#> Warning: NA will be removed in the boxplot.
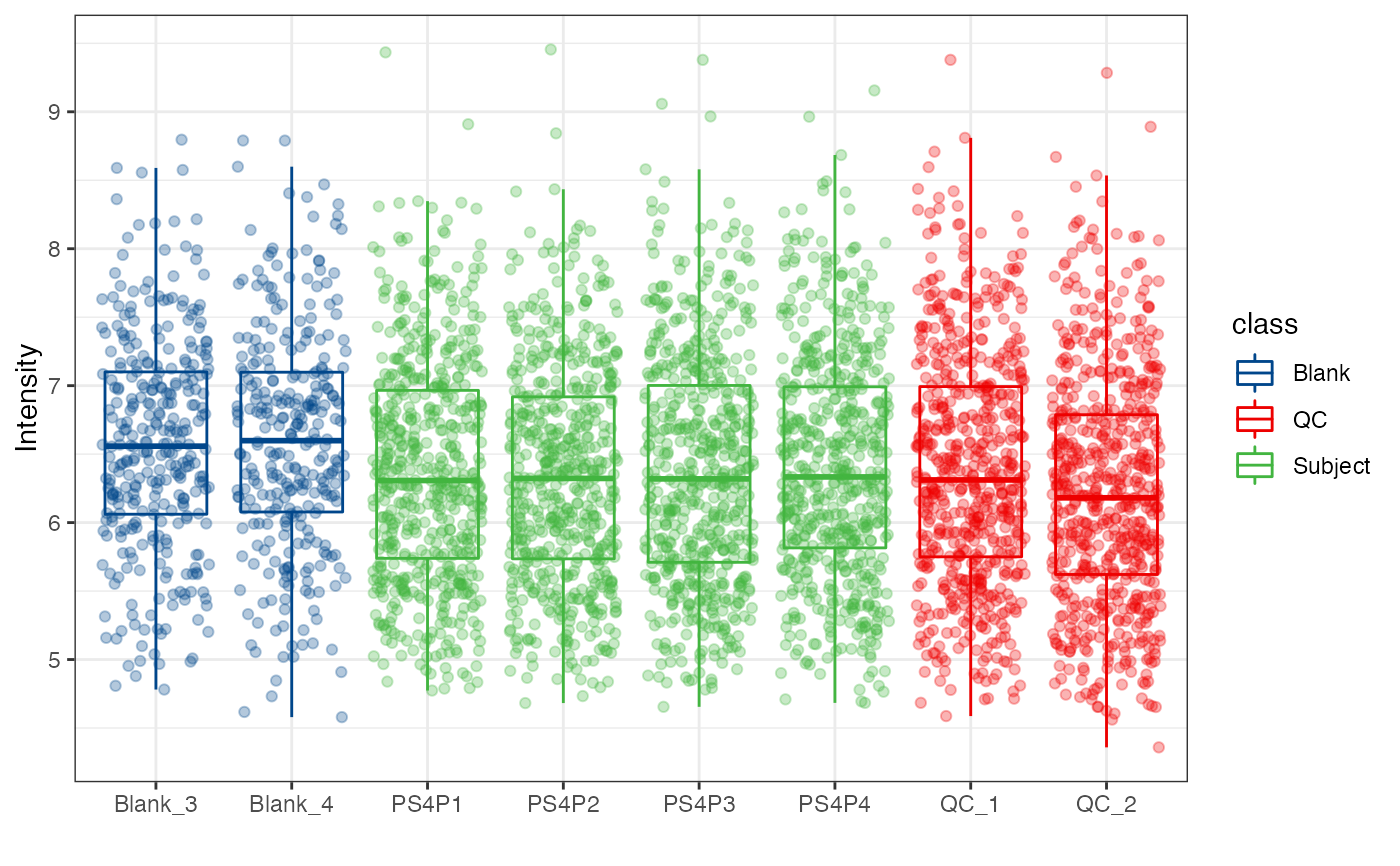
 object %>%
log(10) %>%
massqc_sample_boxplot(color_by = "class",
point = TRUE,
point_alpha = 0.3) +
ggsci::scale_color_lancet()
#> Warning: NA will be removed in the boxplot.
object %>%
log(10) %>%
massqc_sample_boxplot(color_by = "class",
point = TRUE,
point_alpha = 0.3) +
ggsci::scale_color_lancet()
#> Warning: NA will be removed in the boxplot.